


Businesses often frame crises as periods when the focus should be on risk and damage mitigation. However, for a resilient company, crises can instead offer opportunities for differential growth and advantage. Our previous research demonstrates that resilience — the capacity to absorb stress, recover critical functionality, and thrive in altered circumstances — has significant strategic value. Because crises widen the gap between top and bottom performers, ~30% of a company’s long-run relative TSR is driven by how they perform during crises.
Shareholder returns typically move in tandem during normal periods but diverge considerably during crises, and COVID was no exception. In the 18 months before the COVID shock, the average gap in TSR between the 25th and 75th percentile performers across industries measured 75pp. 18 months after the COVID shock, the gap had increased to 105pp.
Now, in the wake of the COVID recovery, two important questions arise: Who are the emerging top performers following the COVID shock? And what lessons can be learned from their resilience to prepare for the next crisis?
Competitive advantage during the crisis
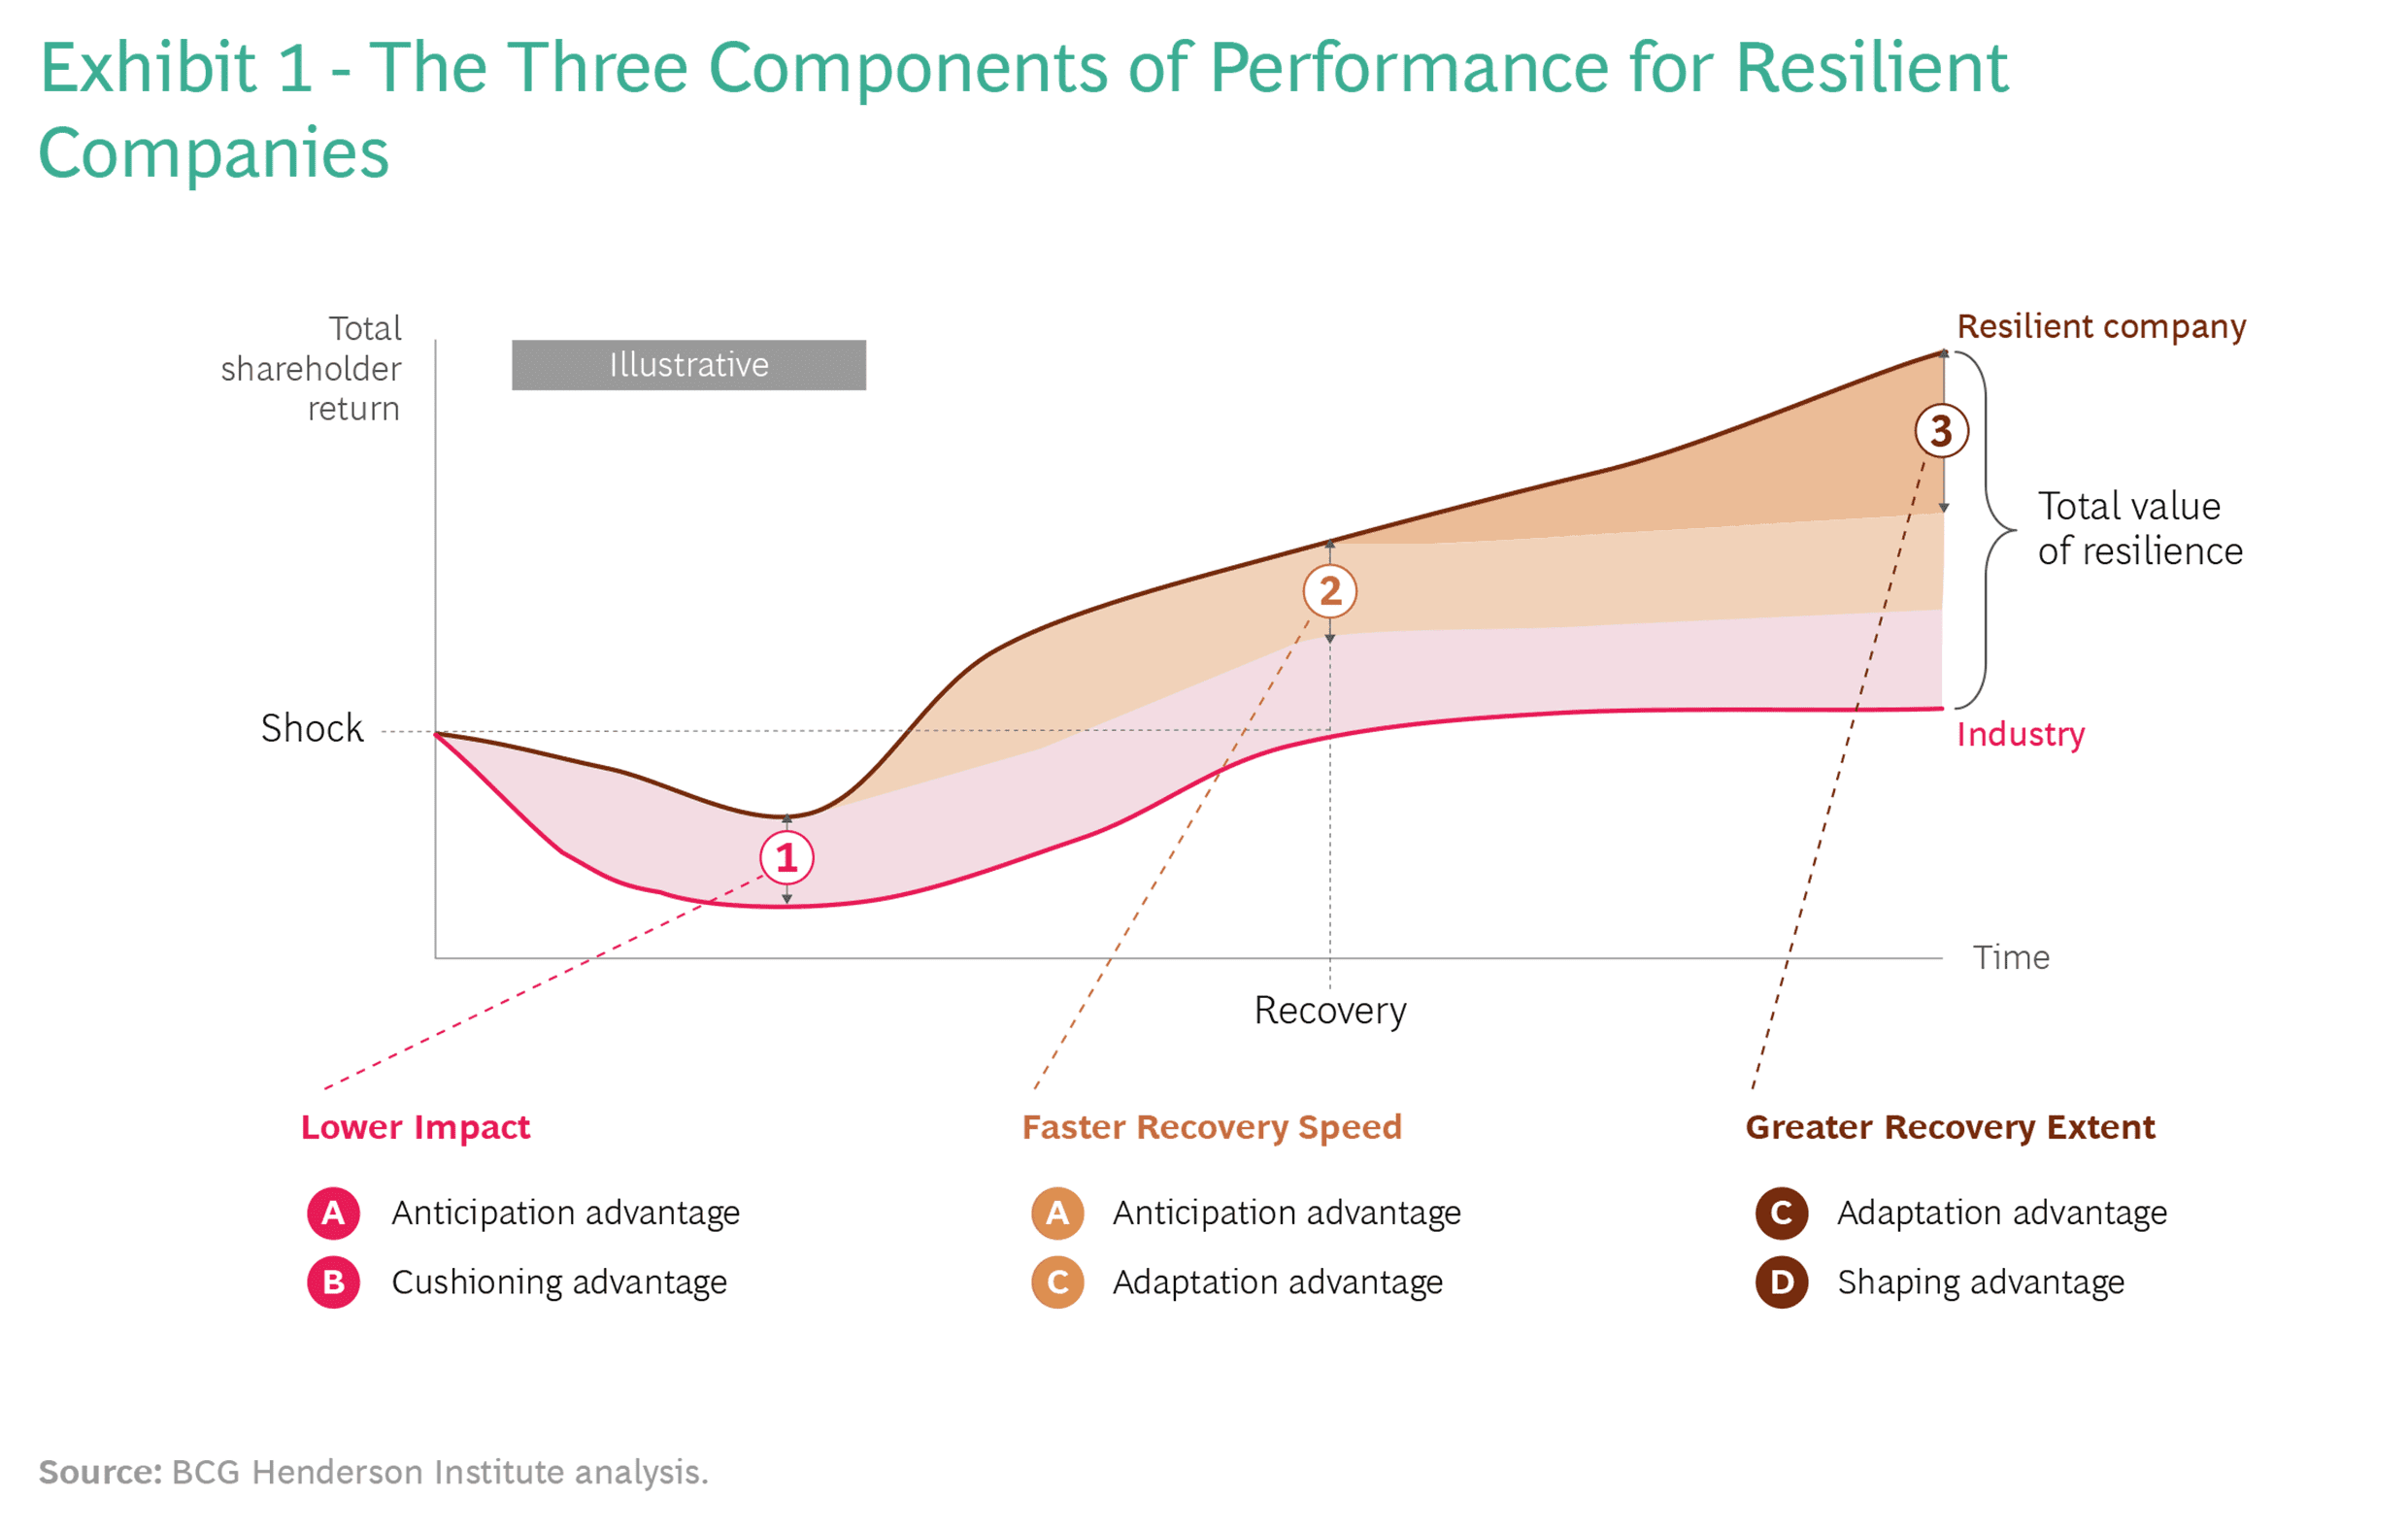
Resilient companies enjoy better outcomes than their peers through a combination of three components of performance. These components are driven by four competitive advantages. Some advantages affect more than one component:
- Lower shock impact: Resilient companies cushion the immediate impact of the shock due to their anticipation advantage (recognizing threats and preparing for them in advance) and cushioning advantage (mitigating or absorbing the immediate negative effects of a shock)
- Faster recovery speed: Resilient companies recover faster than the competition due to their anticipation advantage (preparedness to capitalize on disruption during a crisis) and adaptation advantage (quickly identifying the actions needed to restore operations and implementing them swiftly)
- Greater recovery extent: Resilient companies thrive in the new circumstances after a crisis, due to adaptation advantage (adapting to the new normal post-shock) and shaping advantage (shaping the dynamics of the industry in the post-shock environment to their advantage)
Our previous research on resilience has identified different actions that create each of these advantages:
- Anticipation advantage is created by preparing for long-term shifts, developing contingency plans for disruption, building early warning systems, and constantly scanning the environment for emerging risks
- Cushioning advantage is created by building operational and financial buffers, diversifying revenue sources and operations, organizing with operational modularity and financial separation, being important to consumers, and aligning the company’s purpose with social norms and aspirations
- Adaptation advantage is created by being important to consumers, aligning the company’ purpose with social norms and aspirations, experimenting, being agile, developing operational flexibility, and shifting portfolio mix
- Shaping advantage is created by shaping the post-crisis new normal and redefining industries
The COVID resilience scoreboard
To evaluate how resilient companies outperformed peers during COVID by leveraging these four advantages, we have studied the difference in TSR performance of the world’s largest companies relative to their industries before and after the COVID shock.[1]Pre-shock Performance represents the 18 months prior to the COVID shock (Aug 2018 to Feb 2020). Post-shock Performance represents the 18 months following the COVID shock (Feb 2020 to Aug 2021). Top … Continue reading We defined industries at the most granular level possible, comparing against direct and immediate competitors (“sub-industries”) as necessary. Our goal was to identify competitive advantage independently of broader shifts within their sectors.
We examined the top quartile of performers, those whose resilience led to outperformance of their industries and sub-industries. Half of those businesses were already top performers before the crisis, but the other half were in fact companies that underperformed their industries prior to COVID.[2] We define underperforming companies as those in the 3rd and 4th quartiles for the 18 months prior to the COVID shock. These new winners were able to turn the crisis into an opportunity for growth and emerged at the top of their sectors. [3] Companies who underperformed their industries (in the 3rd and 4th quartile) pre-shock, but rose to the 1st quartile post-shock.
Overall, 12% of companies evaluated emerged as New Winners. However, since deeper crises spell greater opportunity, industries that experienced more severe COVID disruption saw a larger share of New Winners. [4] More severe COVID shocks defined as those in the bottom quartile of shocks, representing over 37% decline to their trough. Average decline to trough across all industries was 30%. In those sectors, such as Hotels, Resorts, and Cruises or Apparel Retail, New Winners represented 16% of companies evaluated.
New Winners turned the COVID crisis into an engine for growth. The following case studies focus on prominent New Winners from 7 industries whose decisions illustrate the different ways in which businesses can achieve competitive advantage and win during crises.
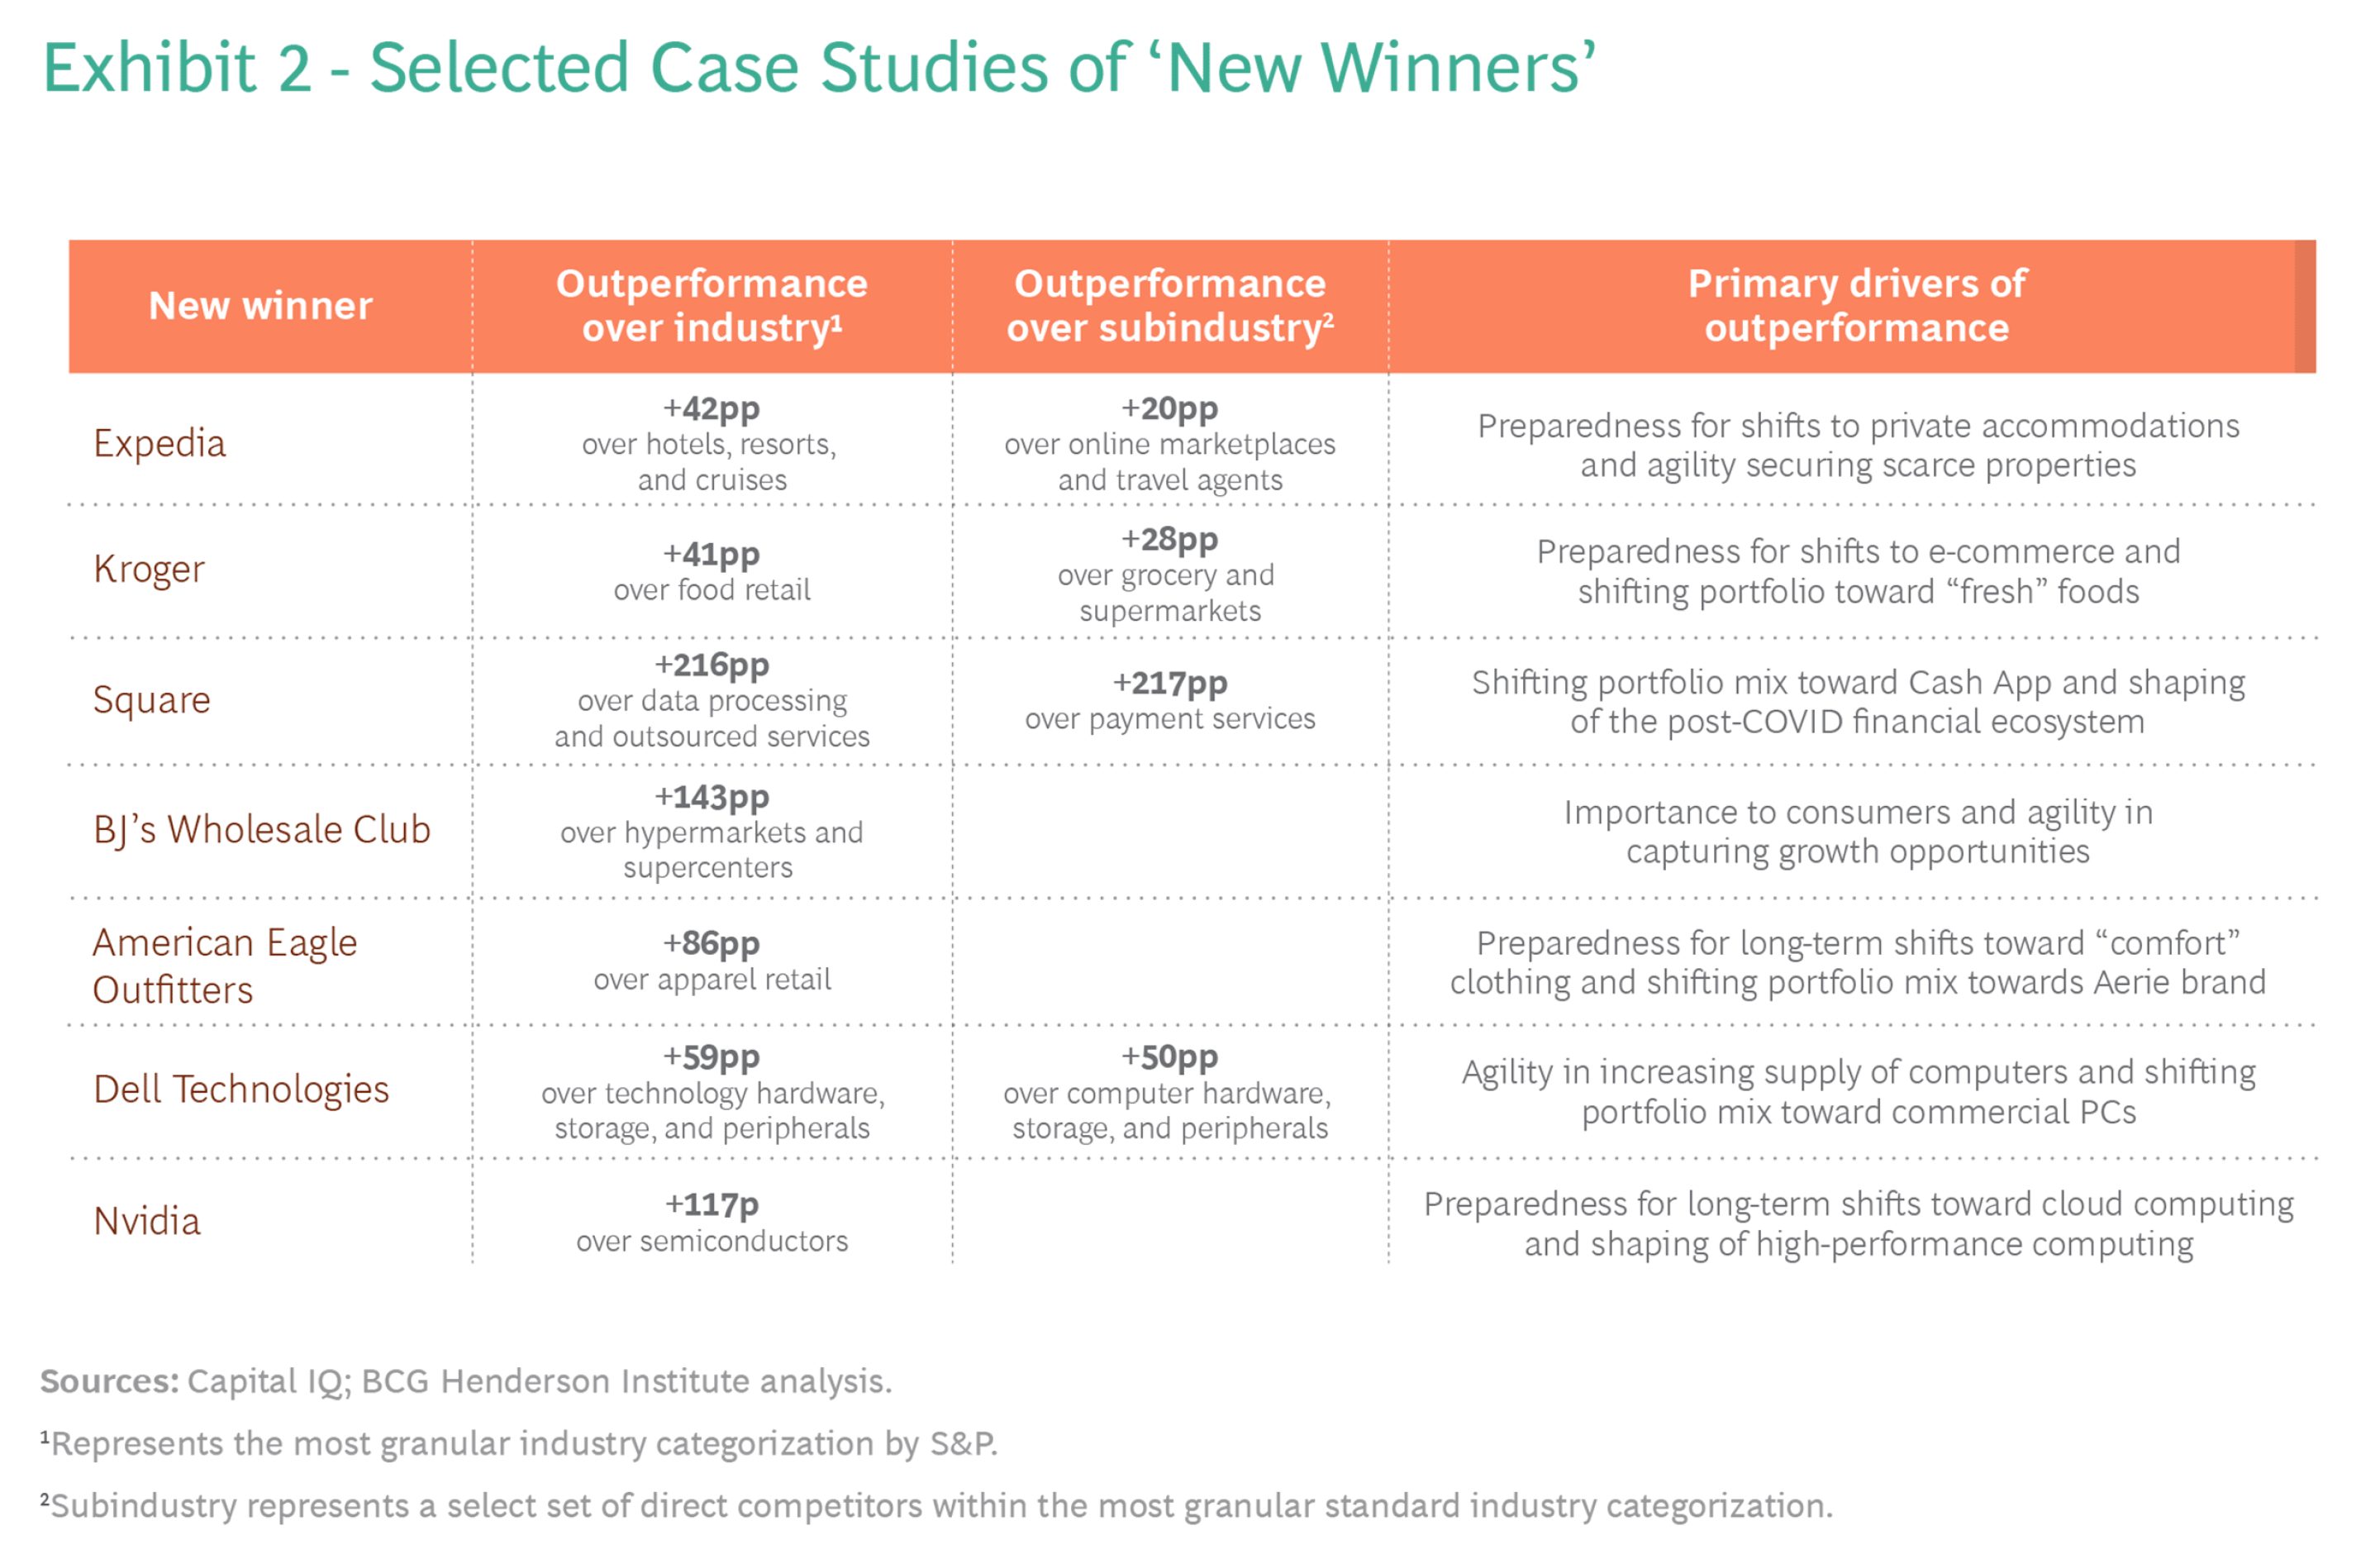
Expedia
Government restrictions and reduced demand severely curtailed travel and tourism during COVID. Although the entire industry has struggled, online marketplaces and travel agencies like Airbnb, Expedia, and Bookings recovered faster and performed better, as their asset-light models enabled them to shift their portfolios toward high-demand travel segments.
Although Airbnb has been widely regarded as a success story in the industry, it is not the only one; for example, Expedia Group, Inc. also embraced the crisis as an opportunity for growth.⁵ Expedia’s outperformance was driven by their preparedness for long-term shifts towards private accommodations and their agility in securing scarce resources — largely thanks to their digital vacation rental platform Vrbo — leading to their faster recovery speed and greater recovery extent.
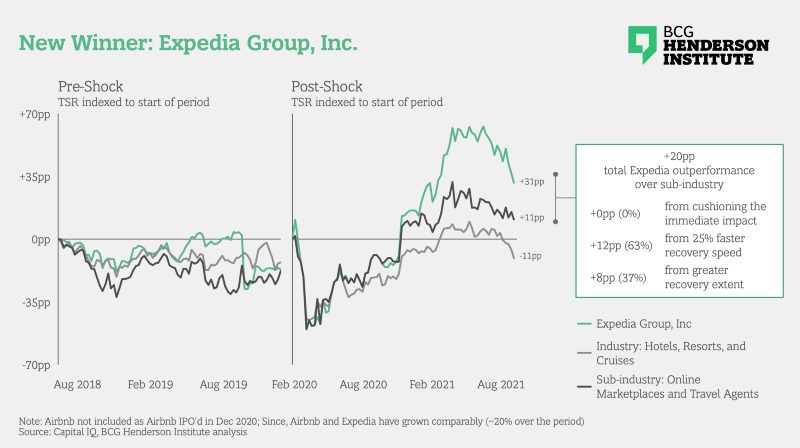
In 2015, Expedia acquired and invested in Vrbo in anticipation of increased demand for private accommodations and vacation rentals. As travel demand shifted to socially distanced private accommodations, Vrbo — which specializes in whole-home properties with 70% of their inventory in vacation markets, the highest among their competitors — captured the shift. By the second quarter of 2021, Expedia’s year-over-year revenue grew almost twice as fast as the industry and 40% faster than the sub-industry of online marketplaces and travel agencies. As Expedia CEO Peter Kern recounted in early 2021, “Vrbo is just about the only part of the company that’s growing.”⁶ Expedia’s preparation for long-term shifts towards private accommodations created anticipation advantage, which contributed to their recovery speed and recovery extent.
Expedia made early moves to capture demand growth in private accommodation rentals, but when the demand rapidly outstripped the market’s supply, Vrbo’s agility helped them to secure increasingly scarce rental properties. Very quickly, Vrbo launched its “Fast Start Program”, incentivizing hosts from other platforms to join Vrbo instead. They ramped up advertising towards hosts, outspending Airbnb by a factor of ten.⁷ Their efforts were successful: Vrbo increased their listings by 21% between January and April 2021; in comparison, Airbnb listings rose just 1% over the same period.⁸ Expedia’s agility created adaptation advantage, which contributed to their faster recovery speed as well as their greater recovery extent.
Kroger
With social distancing requirements leading to more time spent cooking at home, individuals have flocked to food retailers to stock up their pantries. Within the food retail industry, grocery stores and supermarkets have outperformed due to their diversity of product offerings and importance to consumers (offering staples and fresh foods instead of discretionary food typically found in convenience stores). Kroger emerged as a winner from COVID. Kroger’s trajectory, aside from recent company-wide efforts to increase efficiencies, re-invest in fresh in their stores, and improve the customer experience, has been driven by their preparedness for long-term trends in e-commerce and by shifting their portfolio towards their private label offer, leading to a lower crisis impact and a greater recovery extent.
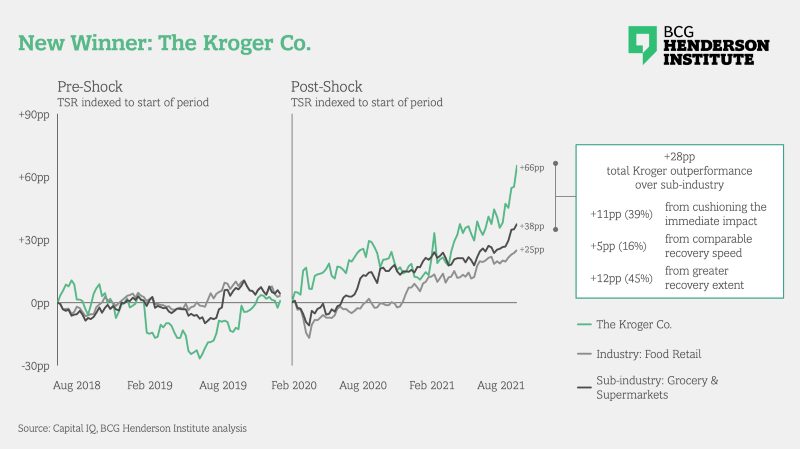
Kroger had accelerated omnichannel investments 3 years prior to the pandemic. By 2019, Kroger was only surpassed by Amazon and Walmart in online grocery sales in the US, with home delivery / pickup already available for 95%+ of US households. When people were apprehensive about in-person contact as the pandemic began, Kroger was ready to offer a robust digital alternative. The company doubled their online sales in the first quarter of 2020, driving total year-over-year revenue growth +7pp over peers. Their preparation for long-term trends toward digital sales created anticipation advantage, cushioning the immediate impact of the COVID shock.
Kroger’s investment in e-commerce, one of the long-term trends accelerated by COVID, paid-off and positioned the company to win in the market. By the end of 2020, Kroger was among the top 10 overall online retail companies across all categories in the US.
Kroger has continued to support their growth by shifting their portfolio towards additional lasting changes in consumer behavior. The company has heavily leaned into emerging trends such as natural & organic, fresh, health & hygiene, and premiumization — all accelerated during COVID — through their highly differentiated private brands. During COVID, their mainstream brand (“Kroger”) offered superior value and variety compared to the majority of competitors; at the same time, Kroger’s Simple Truth and Private Selection brands outperformed the company as a whole, as well as eclipsed competitors on variety, quality and differentiation. Constituting a quarter of their 2020 food sales, private brands have been and will continue to be a growth driver and strategic focus for Kroger, with 660+ new items to be launched in 2021. Shifting their portfolio mix towards new sources of growth in private label has created adaptation advantage, supporting the extent of their recovery.
Square
During the pandemic, companies have accelerated the digitization of their supply chain, customer interactions, and internal operations. Although it experienced an initial shock, the data processing industry and payment processing sub-industry recovered by end of 2020. Square — a payments company composed of business units including Sellers (merchant payment processing, management tools, and financing), TIDAL (music streaming service), TBD (crypto hardware wallet), and Cash App (financial services app) — experienced a deeper shock and initially underperformed the market, but then emerged as a new winner. Square’s outperformance was driven by shifting their portfolio mix towards Cash App and shaping the post-COVID normal through integrated financial services, leading to their faster recovery speed and their greater recovery extent.
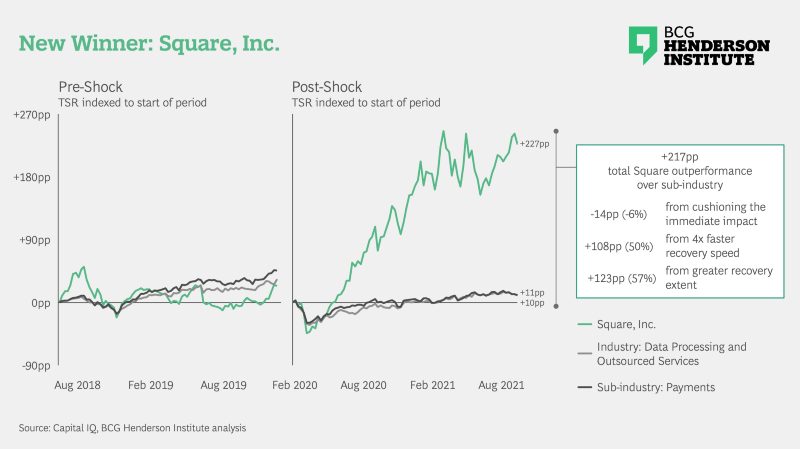
As foot traffic declined for the small businesses for which it traditionally processes payments, Square’s efforts shifted to Cash App to capture the increasing demand for person-to-person transactions and deposits of COVID stimulus checks. During COVID, they increased marketing efforts, launched additional capabilities, and redesigned the interface. Cash App revenue grew 440% in 2020, driving Square’s overall revenue growth 76pp above that of their payment peers. At the same time, Cash App’s gross profit more than doubled, resulting in overall gross profit growth of 50% for Square. Shifting their portfolio mix towards new sources of growth has created adaptation advantage, supporting their recovery speed and recovery extent.
Additionally, during the pandemic, Square combined its Seller and Cash App products into one of the most robust integrated financial ecosystems in the industry. For instance, as of September 2020, employees can receive pay instantly via Cash App for Square’s payroll service. As of March 2021, users can track their Square Loyalty points on Cash App. These integrations have driven growth in both Cash App and the Seller segment. Square attributes a 40% year-over-year increase in transactions per customer on Cash App to customers using the broader product ecosystem.⁹ Within the Seller segment, Software and Integrated Payments was the fastest growing category, due to the increased adoption of products that amplify the ecosystem’s value proposition.¹⁰ Investments in Square’s ecosystem — reflected in both Cash App and the Seller segment — accelerated overall growth differential, as year-over-year revenue growth for the second quarter of 2021 grew to 92pp above their peers. Square’s evolution from a payment company to a differentiated consumer and merchant services platform has created shaping advantage, driving the extent of their recovery.
BJ’s Wholesale Club
Hypermarkets and supercenters such as Costco, Walmart, and BJ’s — which sell everything from groceries to electronics, furniture, and personal care products — initially declined as consumer spending decreased, but recovered alongside the economy in late 2020. BJ’s Wholesale Club emerged as a winner in the industry. BJ’s outperformance was driven by their importance to consumers and their agility in securing growth opportunities, leading to their faster recovery speed and greater recovery extent.
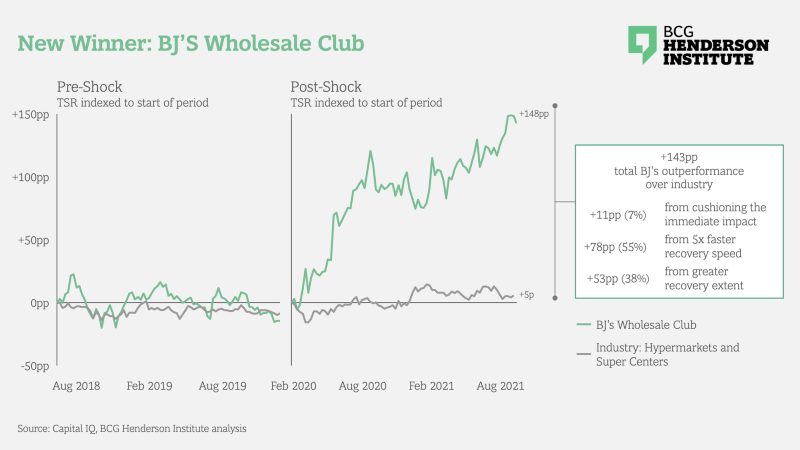
Almost three-quarters of BJ’s total sales come from grocery products (as opposed to electronics, personal care, etc.), a greater share than competitors such as Walmart and Costco. Food was a staple during the pandemic, making BJ’s less sensitive to fluctuations in demand than its competitors. In fact, it even benefited them: BJ’s experienced a significant increase in membership volume (including premium memberships) and same-store sales as “Food at Home” trends gained in prominence. BJ’s same-store comparable sales growth of 21% for the two years leading to Q2 2021 was 3pp greater than Costco and 6pp greater than Walmart. Their importance to consumers and embeddedness in their lives created adaptation advantage, supporting their recovery speed and recovery extent.
BJ’s quickly leaned into their growth. They accelerated store openings with 4 new stores in 2020 and an additional 6 planned for 2021, up from 1 new store per year in 2019 and 2018. In comparison, competitors decelerated their new store openings: Costco opened 16 new stores in 2020, down from 25 in 2019 and 2018. Labor shortages have also plagued the retail industry during 2021: in order to secure labor to supplement their growth, BJ’s used incremental earnings to fund the biggest wage increase in its history, bringing its average hourly wage to a level that differentiates it from most competitors.¹¹ Securing scare resources and growth opportunities supported their 25% revenue growth from the second quarter of 2019 to 2021, 8pp faster than the industry. BJ’s agility created adaptation advantage that supported their recovery speed and recovery extent.
American Eagle Outfitters
Apparel retailers suffered immediate losses during the pandemic due to declining consumer spending and limited in-person interactions, only recovering as social distancing guidelines were relaxed. American Eagle Outfitters (AEO) — composed of the American Eagle and Aerie brands — experienced a deeper shock and initially underperformed the industry, but then emerged as a new winner. AEO’s outperformance was driven by their alignment with long-term trends towards “comfort” and shifting portfolio mix towards Aerie, leading to their faster recovery speed and greater recovery extent.
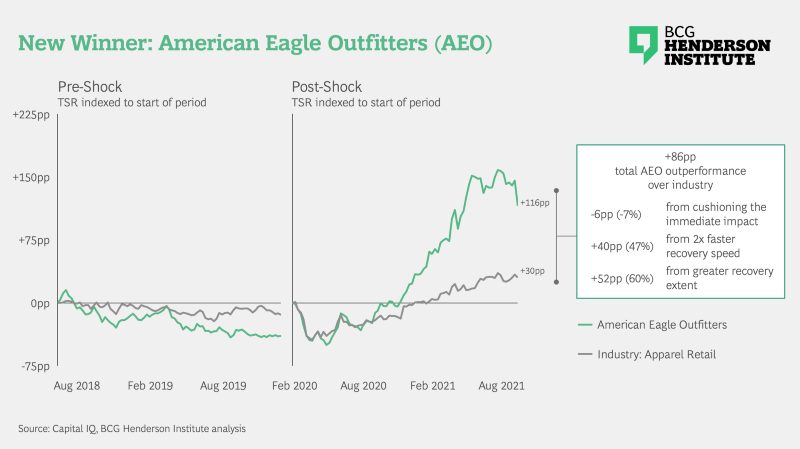
Before the pandemic, Aerie led the industry in “comfort”, both physically (focusing on intimates and loungewear) and emotionally (in 2014, they were the first major apparel brand to stop retouching or photo editing models). During the pandemic, as stay-at-home orders led individuals to seek “comfort” over fashion, Aerie was ready to meet the demand. In the second quarter of 2020, Aerie revenue grew 32% year-over-year, partially offsetting American Eagle’s downturn for an overall -15% revenue decline, which was more modest than the industry’s -24% average. AEO’s preparation for long-term shifts towards “comfort trends” created anticipation advantage, which contributed to their recovery speed.
In addition to preparing for long-term trends, leaning into growth was vital for AEO’s success. Aerie leaned into store expansions to enter new markets and grow brand awareness, opening 27 stores in 2020 (an 18% increase in store count), with 60 more store openings planned by the end of 2021. At the same time, the American Eagle brand saw a significant shift in how it was being managed and early progress on right-sizing its store footprint, with the company shutting down 44 stores in 2020 (a 5% decrease in store count).¹² The pivot in focus — shifting towards growth opportunities with Aerie — has paid off: driven by Aerie, AEO revenues grew 9pp faster than their peers from the first half of 2020 to the first half of 2021. Optimization of American Eagle has increased AEO’s overall margin by 2.4pp over the same period. Shifting their portfolio mix towards new sources of growth has created adaptation advantage, supporting both their recovery speed and recovery extent.
Dell Technologies
The consumer electronics industry suffered an immediate shock when the crisis crippled much of their supply chain and stunted consumer demand. However, a broad shift towards remote engagement has boosted demand for technology, supporting the industry’s recovery. Dell experienced a deeper shock than its peers and initially underperformed the industry, but then emerged as a new winner. Dell’s outperformance was driven by their agility in increasing supply and shifting portfolio mix towards commercial PCs, leading to their greater recovery extent.
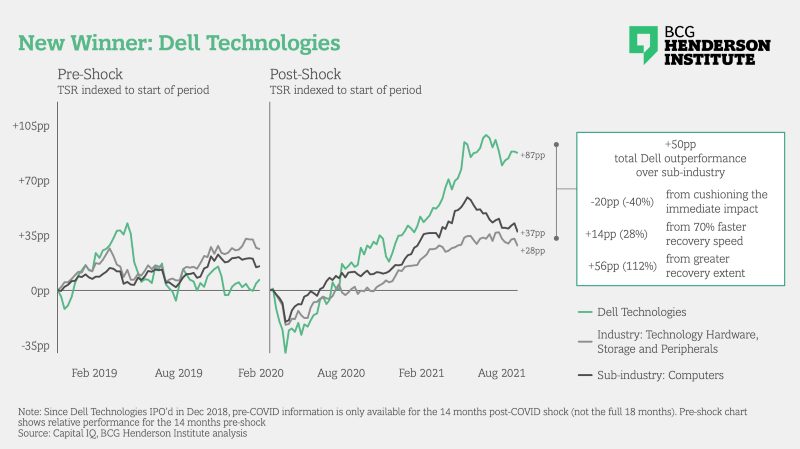
A shortage of computer components hampered PC shipments starting in the second half of 2020; supply, not demand, was the limiting factor for sales. Among the largest manufacturers of PCs — Dell, HP, and Lenovo — Dell saw the largest increase in year-over-year supply for the second quarter of 2021, 2pp above Lenovo and 13pp above HP. Dell’s supply chain agility stems from its direct management of component suppliers: fast communication channels and long-term relationships made suppliers more flexible and responsive to their demands. Conversely, HP attributed their under-performance to outsourcing, as design manufacturers and not HP itself manage suppliers.¹³ Dell’s ability to rapidly increase capacity when others were experiencing supply chain issues gained them almost 2pp market share at the expense of HP and Lenovo.¹³ Their agility created adaptation advantage, driving the extent of their recovery.
During the pandemic, the percentage of workers who worked from home grew from 20% to 71%.¹⁴ This rapid rise in remote working led to commercial laptops growing in demand faster than consumer laptops. Dell doubled down on commercial PCs by positioning their portfolio for new working norms (launching new products with bigger monitors, interactive displays, advanced cameras, mobile workstations) and pivoting their supply chain to increase capacity for commercial rather than consumer PCs. In the second quarter of 2021, Dell reported commercial PC revenue increasing 32% year-over-year, driven by increasing their share of commercial PCs to ~75% — an increase over the prior year and a larger percentage than the company’s biggest competitors.¹⁵ This resulted in revenue growing more than twice as fast as their peers’. Shifting their portfolio mix towards sources of growth has created adaptation advantage, supporting the extent of their recovery.
NVIDIA
As PCs, smartphones, gaming consoles, and data centers surged in demand during COVID, so did the semiconductors that power them. Within the industry, NVIDIA emerged as a new winner. NVIDIA’s outperformance was driven by their preparedness for long-term shifts toward AI and cloud computing and shaping of the post-COVID normal with many new innovations, leading to their faster recovery speed and greater recovery extent.
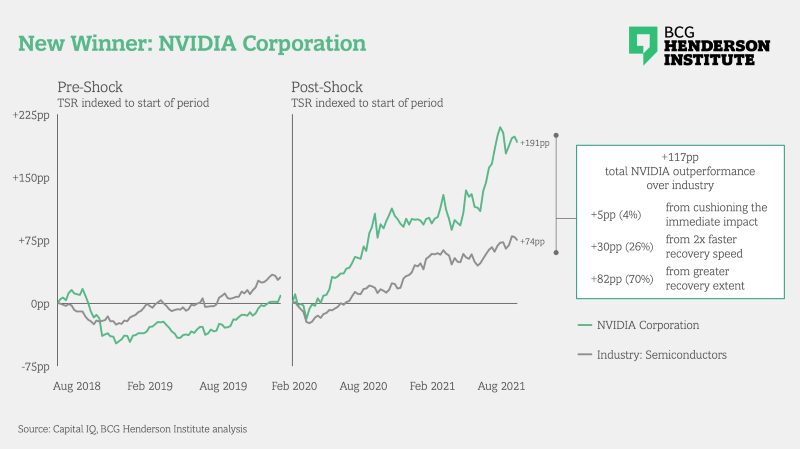
Historically, NVIDIA has been best known for its gaming GPUs, processors that significantly improve gaming application performance. Over the past several years, NVIDIA placed a bet on expanding the use of GPUs beyond gaming to other intensive computing applications, specifically within artificial intelligence and cloud computing. As pioneers in the field, NVIDIA’s accelerated computing solutions run intense computer graphics, scientific computing, and AI functions in significantly less time and with less power consumption than competitors. As a result, NVIDIA quickly became the market leader; for example, by 2019, NVIDIA GPUs were deployed in 97.4% of AI accelerator instances for the top four cloud providers.¹⁶ When remote work made the cloud more popular — and increasing AI adoption drove the need for more accelerated computing — NVIDIA was in a powerful position to capitalize on the increase in demand. Over 40% of NVIDIA’s total sales in 2020 were from their Cloud & Data Centers segment (up from 27% in 2019), driving overall revenue growth for the company +20pp over the industry. NVIDIA’s preparation for long-term shifts towards cloud computing created anticipation advantage, which contributed to their recovery speed and recovery extent.
NVIDIA’s outperformance reflects not only growth in its existing offerings, but also future growth value from investments in the next wave of high-performance semiconductors. In 2020, NVIDIA’s R&D intensity was 1.5 times the industry average across a range of high-potential initiatives.[5]R&D Intensity defined as R&D spend as a percent of revenues. For example, growth in their desktop workstation GPUs has propelled professional visualization revenue to more than half a billion by the second quarter of 2021, up 156% from the year prior. While only accounting for 8% of total revenue, the segment has become the platform for launching the world’s first 3D, real-time simulation and collaboration platform — revolutionizing visual rendering and solidifying NVIDIA’s leadership in professional visualization. Additionally, although automobiles are NVIDIA’s smallest segment, throughout the last year they have announced an $8B+ pipeline to bring autonomous driving and AI technologies to the world’s largest automobile manufacturers. And in September 2020, NVIDIA announced the industry’s largest deal in history, agreeing to acquire Arm Limited (a leader in smartphone chips, a new industry for NVIDIA) from SoftBank for $40B.[6]Deal awaits regulatory approval. NVIDIA’s bold moves to redefine and elevate standards across a growing number of categories have created the shaping advantage that drives their recovery extent.
Lessons from COVID
Our analysis of competitive dynamics during COVID, as illustrated by these case studies, confirms our view that resilient companies are better able to thrive in crises. However, the way in which companies navigate shocks to create competitive advantage can vary significantly depending on the crisis.
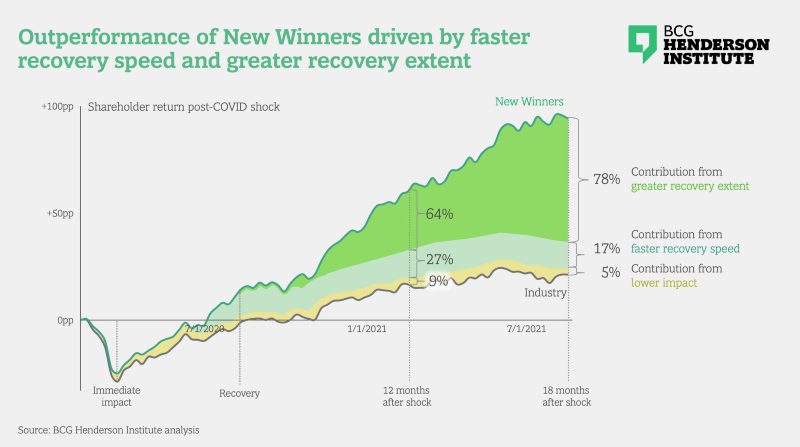
Our historical analysis indicates that over the past 25 years, outperformance during crises was primarily driven by withstanding the immediate impact of the shock. For the 12 months after a shock, the lower impact of the shock accounted for 63% of relative TSR, faster recovery speed accounted for 23%, and greater recovery extent accounted for the remaining 14%. Yet for the new winners emerging from COVID, the primary contributors to outperformance have been significantly different. On average, New Winners did not outperform due to withstanding the immediate impact of the shock; instead, they outperformed due to their faster recovery speed and, most importantly, their greater recovery extent. For the 12 months after the COVID shock, 9% of their outperformance was driven by lower impact, 27% by their faster recovery speed, and 64% by their greater recovery extent. For the 18 months after the shock, their greater recovery extent contributed even more to their overall outperformance (78%).
New Winners from COVID were able to react and recover more quickly and to a far greater extent than their peers, even if the initial effects of the shock were equally or more severe for them as compared to their competitors. What did New Winners consistently do that drove their recovery?
Organizations that emerged as winners didn’t just get lucky — they thought long term. It is easy to assume that Expedia got lucky with private accommodations or that Kroger got lucky with its digital capabilities. But what appears to be luck are instead strategic decisions that New Winners made to act on emerging trends and shifts that were already visible before the pandemic. They took these trends seriously; when they noted shifts, they acted to stay ahead of them.
Our proprietary natural language processing analysis of SEC filings and annual reports indicates that New Winners’ language was rated 12% higher in long-term orientation relative to the average. By preparing for long-term shifts, New Winners demonstrated superior anticipation advantage over their peers: although this did not significantly help cushion the immediate impact of the shock, it supported their recovery speed and recovery extent. New Winners were prepared for disruptions in their industries, which allowed them to better react to them. As a result, they recovered 2–3 times faster than their industry, on average.
Organizations that emerged as winners didn’t focus only on lessening the impact of the crisis — they thought of it as an opportunity for growth. Companies such as American Eagle, Dell, or BJ’s did not view the crisis as only a negative event and resilience as the short-term minimization of negative impact; instead, they viewed it as an opportunity to outperform competitors by learning faster from changing circumstances and doubling down on shifts.
Their adaptation advantage — their agility in securing scarce resources or shifting their portfolio mix toward new sources of growth — helped them achieve superior revenue growth over their competitors. In the second quarter of 2020, New Winners achieved +28pp higher revenue growth year-over-year than underperforming companies. As the pandemic progressed, that gap widened to +64pp for Q2 2021 year-over-year growth — underlying the New Winners’ recovery speed and greater extent of recovery.
Organizations that emerged as winners didn’t just react to unfolding events in their industries — they shaped them. The COVID crisis changed the world. Some of those changes will be reversed, but many will not, among other reasons, because New Winners shaped the new normal. Companies such as NVIDIA and Square influenced ecosystems of customers and partners to redefine industry standards — to their long-term advantage.
New Winners invested in defining the futures of their industries during the pandemic by building new partnerships and launching industry-shaping products. The R&D intensity of New Winners grew 2–3x between the second quarter of 2019 and 2021– while those who newly underperformed declined by a third. Their shaping advantage helped them define a new normal post COVID — one that solidified their outperformance in the long-term. Several benefits have already been realized, and many are still to come.
As company performance diverged during the pandemic, New Winners were able to benefit from the crisis by leveraging dynamic capabilities — those which depend on anticipation, adaptation, and shaping — to outperform their industries.
The New Winners have shown that crises are not exercises in damage mitigation, but powerful competitive opportunities which can be seized by the nimble. Building the capabilities of resilience has paid off not just in the current crisis; it also positions these companies well to weather future shocks.
[5] https://www.wsj.com/articles/airbnb-post-pandemic-travel-11623429935
[6] https://www.yahoo.com/now/expedia-q-4-2020-vrbo-travel-industry-hotels-airbnb-141519859.html
[7] https://skift.com/2021/04/26/vrbo-outspent-airbnb-10-fold-on-advertising-early-in-2021/
[8] https://skift.com/2021/05/19/expedias-vrbo-warns-of-limited-supply-at-summer-hotspots/
[9] https://www.fool.com/investing/2021/05/14/3-factors-driving-squares-cash-app-profits/
[11] UBS Equities
[12] https://s26.q4cdn.com/546305894/files/doc_financials/2021/ar/Final-Bookmarked-AR-4.21.21.pdf
[13] https://www.tomshardware.com/news/pc-sales-in-q2-2021-dell-enjoys-growth
[14] https://techmonitor.ai/technology/hardware/dell-pc-strategy-hp-cio
[16] https://investors.delltechnologies.com/static-files/a3af278f-66f9-473f-baac-165d5d8f021f
The authors would like to acknowledge and thank BHI Strategy Lab members who have supported the publication of this piece, including Tom Deegan, Gal Ben-Chorin, Leesa Quinlan, and Devon Schindler.