

This research was published on April 14th, 2020
Economic forecasts are fragile in the best of times and hazardous when the event in question falls outside the empirical range of the model, as is the case with the current macroeconomic shock of coronavirus. To illustrate these problems, we revisit the Challenger shuttle explosion in 1986, a tragic example of such modeling failure and of invisible barriers of communication between modelers and managers. The age of coronavirus has put economic conditions (and data) far outside the empirical range of forecast models, making an understanding of the fragility of forecasts indispensable. We outline 5 lessons for leaders on how to engage with growth forecasts as they navigate the crisis.
Images of the explosion of the Challenger space shuttle in 1986 are anchored in the public consciousness, marking a turning point in attitudes towards space programs. What may be less well remembered today are the findings of the Rogers Commission, which was convened to study the causes of the disaster: an O-ring, a seal near the fuel tanks which became rigid at cold temperatures, failed to seal, and led to the losses in human lives, as well as in reputation and confidence.
Though coronavirus is an epidemiological and economic tail risk rather than an engineering one, the O-ring incident contains relevant lessons for modeling and forecasting the consequences of events that fall outside the known empirical range, including economic ones. The O-ring failed because its reliability near 30ºF launch temperature was modeled on an empirical range of 50–85ºF. Likewise, modeling the economic consequences of a shock like coronavirus — an unprecedented real economy freeze that inevitably will lead to an extreme quarterly GDP decline — falls far outside the empirical range of quarterly shocks we know (rarely more than -5%). The power of models, which is limited even in the best of times, is far weaker when they are applied under extreme conditions.
Beyond lessons for forecasters, the O-ring incident also contains important lessons on how analysis and management decisions intersect, and how those conducting analysis should communicate with those who make decisions.
Modeling beyond the range of experience
Predictive models, including economic forecasts, are essentially the application of past empirical relationships to new situations on the basis of observed or assumed causalities. To produce a forecast, we “feed” models with past empirical data in order to be able to extrapolate the consequences of a new or hypothetical event. NASA had, of course, empirical experience upon which the O-ring was deemed to be safe. Exhibit 1 shows the original chart that NASA used to develop the view that there was no relationship between outside temperature and O-ring incidents, based on an empirical range of launches that occurred between 50–85ºF. The problem was that it falsely inferred the O-ring’s reliability at lower temperatures on the basis of the known empirical range.
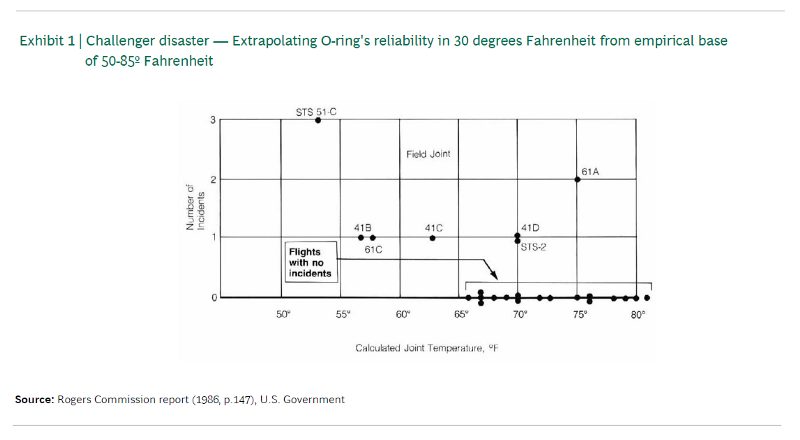
The actual temperature on that January morning was around 30ºF, a much cooler temperature that is quite literally off the chart (see lower bound of x-axis of Exhibit 1). The decision to go ahead at that temperature rested on analysis that extrapolated the O-ring’s reliability outside the known empirical range. Yet, at 30ºF the O-ring become rigid, failed to seal, and ultimately caused the fuel tanks to explode. While a low probability/high impact risk, it is an extremely costly demonstration of the risk of extrapolating models beyond their empirical range. The dangers of thinking you know something you simply don’t know can be extremely high.
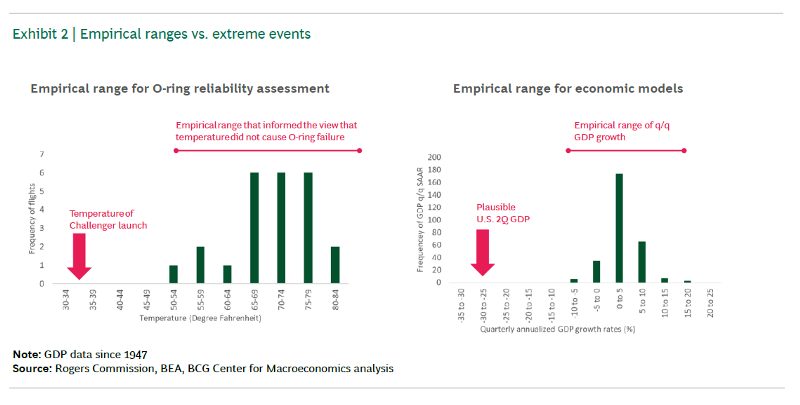
The situation is not so different when it comes to modeling the consequences of the coronavirus shock. Much like the 30 degrees Fahrenheit, a severe real economy freeze that forces a large quarterly GDP impact (of say -25% annualized or more) is quite literally outside the empirical range that informs macro models.
Exhibit 2 juxtaposes the two empirical ranges in question — observed O-ring temperatures and observed quarterly GDP drops — and highlights where the two conditions (30ºF and -25%) locate on the respective distribution of observed events.
Keep in mind that economic forecast models are anything but reliable even when predicting the impact of shocks that lie within the outlined empirical range. How could an extrapolation so far outside that range be expected to be meaningful?
Understanding the nature of economic forecasts
The O-ring example is a good analogy to articulate our objection to rigidly clinging to forecasts and models. It’s dangerous even when dealing with events from within the empirical range, and quite meaningless when the shock comes from the tail end of the risk distribution. Basically, in these cases we should either disregard point forecasts or, if still inclined to use them, be very aware of their tenuousness.
In truth, economic forecasts are broadly misunderstood. Those who construct them in good faith know of their limitations and they also know that their scientific veneer of precision makes a larger impression on those consuming forecasts than is deserved. In some sense, they are feeding the appetite for clarity, simplicity, and precision rather than accurately communicating the confidence of the modeler.
A fair take on economic forecasts is that they are (hopefully) carefully constructed numerical summaries of the available information and assumptions at a given point in time. When the facts change, or the assumptions, the forecasts should change. When the facts change beyond the range of experience the model itself should change, be handled with extreme care, or be abandoned. Few in the financial world, where most GDP growth forecasts originate, think of their forecasts as a source of static truth upon which major business decisions can be made. Rather, forecasts are a means of concisely expressing currently available information and views to clients and colleagues. Think of forecasts as a precise numerical shorthand which forms part of a continuous conversation.
With that view of forecasts, what happened in the month of March should be less bewildering. In Exhibit 3 we show the daily decay of the median broker forecast. Not only were the forecasts slow to catch on — they showed 0% 2Q GDP growth well into March — but then fell continuously to hit lows below the -30% mark. That’s a 30%-point shift in just 21 business days.
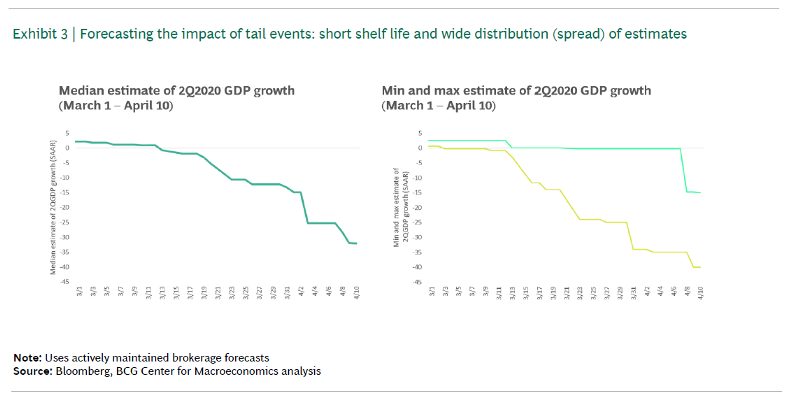
The spread of forecasts is also instructive — in excess of 2000 bps between minimum and maximum forecast. And remember this is the spread of the mean expected outcome, which tells you nothing about the probability distribution underlying each estimate.
Economics forecasts will continue to be tenuous as long as the extraordinary environment persists and there will be little basis for relying on them for decision making.
The O-ring contains lessons for modelers and managers alike
Beyond the lessons on forecasting and modeling, we note that the O-ring disaster also contains perennially relevant lessons for the interactions between those who make forecasts and those who use forecasts in decision making. As the Rogers Commission demonstrated in the aftermath, the O-ring was a known problem prior to the disaster. In fact, some engineers had raised concerns about its reliability in lower temperatures. Why were they not heard by management?
The answer is more complex than pointing to the silencing of uncomfortable objections. The concerns were noted, but a seemingly impossible burden of proof was placed on reassessing the O-rings reliability. Given that the accepted empirical basis for the O-ring modeling was successful prior shuttle launches, demonstrating the problems in cooler temperature looked like an impossible task for dissenting engineers. Such breakdowns in communication are probably familiar to all of us, though of course they rarely have the same probability/impact profile as in this case.
And while much blame seems to rest with management (including on the day prior to launch when concerns about the O-ring were raised and dismissed again), there is also an important lesson for those who conduct modeling analysis and need to communicate its intricacies, limits, and thus risks. Did the argument about temperature risks for O-ring viability really need to be constrained by empirical launch data?
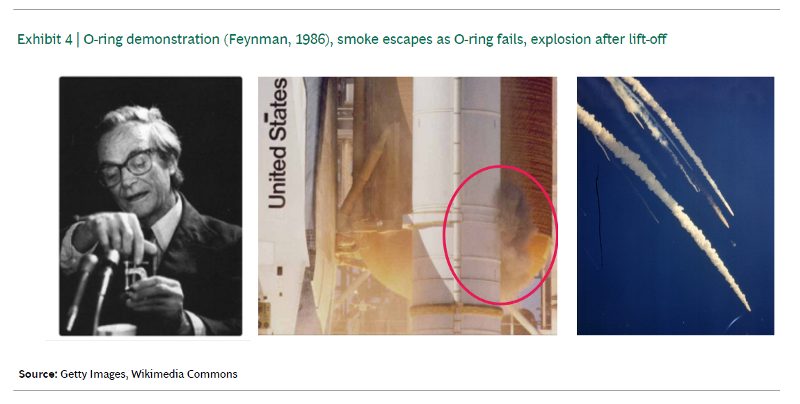
Not really. In 1986 Richard Feynman, a noted physicist and member of the Rogers commission, conducted a simple, yet powerfully pragmatic experiment during TV testimony (Exhibit 4). He dipped an O-ring specimen in a glass of ice water and then showed the material was too rigid to return to its original shape to effectively serve as a seal. Of course, the benefit (and ease) of hindsight is always treacherous, but there is a powerful lesson here about the need and possibility of transcending the invisible barriers between analytical work and management decisions.
Five lessons for leaders
What are we to take away from all this?
- Even in the best of times, be realistic about the nature of economic forecasts. Don’t mistake them for accurate predictions of the future but accept them as summaries of the present information and forecaster’s opinions. Don’t take them at face value, and don’t expect them to last, by design they have to change when the facts change. Know that there is a distribution underneath the point estimate which needs to be taken into account.
- Be very skeptical of forecasts when they are about events outside previously observed empirical ranges. There is a difference between “regular economic forecasts” which are flimsy enough, and “extreme situation” forecasts, which are likely to be very wrong. Knowing and acknowledging that something is unknown or unknowable leads to better decisions than pretending it is. We may often crave a simple, precise estimate but the effectiveness of the modeling-forecasting-decision making system should be prioritized over psychological comfort.
- Be careful not to demand the impossible from forecasters. How do you interact with running analysis in your organization? Do you demand a single prediction, or do you allow for and encourage first and higher order levels of uncertainty to be factored in — particularly when the downside is large. Are burdens of proof commensurate with the risks involved?
- Challenge analytical forecasters to communicate outside of their technical confines. It’s easy for all of us to be stuck in habits defined by our domain of expertise. We think and communicate in language reflecting those habits. Yet the invisible borders of methodology, knowledge, and jargon can amplify risks. Some of those risks can be reduced by challenging ourselves and others to communicate pragmatically, practically, and understandably in unfamiliar settings.
- Most importantly, use scenarios rather than forecasts when the risks are large. A forecast is a single version of the future, driven by necessarily narrow and deceptively precise assumptions. Scenarios are multiple versions of the future with transparency of assumptions that allow you to continuously assess the progress against mental models of the situation. They facilitate stress testing of business models against plausible unfavorable futures, using a precautionary principle. These factors contribute to better outcomes because uncertainty is explicitly factored into the decision-making process.